The goal of this blog post is to summarize our recent study on COVID-19 and student mental health, and do a bit of science translation of our core findings. You can find the paper accepted in Clinical Psychological Science here, and all data, code, measures, codebooks, and all other relevant material here. Click on the figures below for higher resolution versions, or navigate to our repository for vector graphics.
1. The setup: novel coronavirus in the Netherlands, March 2020
We had planned to conduct a study on student mental health, using Ecological Momentary Assessment (EMA). This is a fairly recently developed form of measurement in which we query participants, multiple times per day on their smartphones, about how participants are doing right now. This has many advantages, including increased ecological validity and limiting recall bias, because we really ask people in the very moment on how sad they feel, or how nervous they are, or how much they worry about their health and the health or their relatives regarding COVID-19. It’s very different (and at least equally interesting) than usual psychological questionnaires that ask questions like “Over the last 4 weeks, how sad were you”. The study was supposed to start on Monday March 16, not long after the first cases of COVID-19 in the Netherlands.
I created a plot to show you when our study took place, in relation to the infections and deaths in the Netherlands, as well as in relation to a dramatic decrease of public transport requests (via Apple Maps), compared to January 2020. This shows how severe disruptions of public life were in March. I don’t want to claim that the Netherlands was hit particularly hard (it was not), but I want to make the point that compared to a few weeks earlier, there were dramatic changes in the daily life of students.

These disruptions of daily life caused novel, once-in-a-lifetime stressors for students, including: ban of public gatherings; ban of non-essential international travel; closing of, among others, universities, schools, restaurants, cinemas, and gyms; shortage of some basic supplies due to mass purchases; health concerns about family and friends; and economic concerns. Our goal was to study the impact of these stressors on student mental health.
We therefore amended our study to include COVID-19 related outcomes. The reason that we share one of the first EMA datasets of mental health during the early days of the COVID-19 outbreak (I’m not aware of any others, but I am sure they exist) is that we have done similar studies in the past, so we came into this with some experience in terms of what questions to ask, and what smart phone applications to use for EMA. But also because we already had a study planned, for several months, which we only needed to adapt.
The collected data are quite unique when it comes to stress research. Here it’s important to understand that there is a lot of fantastic research on mental health in students, because students are a vulnerable population, and there is much work demonstrating that mental health problems are higher in students that the general population. This, together with the facts that most severe mental health problems start before the age of 24, and that students samples are fairly easy to recruit, means that there is a considerable body of research on understanding, predicting, and preventing stress and mental disorders in students.
But: only a minority of this work is prospective stress research, i.e. where you follow students during a period of intense stress, assessing their data at multiple time points. Not because researchers are not interested, but because this is hard to do — it’s challenging to predict future periods of intense stress and start assessments before that such periods. Srijan Sen at University of Michigan has done stellar work on the topic (I had the honor to collaborate with Srijan on his prospective stress data during my PhD), but it’s overall rare.
And among prospectives stress research, there is nearly no work that has followed students closely, using EMA, during periods of intense stress. Which makes our data so exciting, despite all its limitations.
2. Details about the study, and our research questions
We enrolled about 80 bachelor students from Leiden University into our study — over half of them international students — and queried them on a 45 minutes baseline questionnaire; on 14 EMA items1, 56 times over the course of 2 weeks (so 4 times per day); and on a 20 minute exit questionnaire.
EMA data were related to mental health problems, social contact and isolation, and concerns about the pandemic. At study exit, we also collected information on COVID-19 diagnosis, mental health, implementation of social distancing and personal hygiene behaviors, and whether students felt well informed by Leiden University and the Dutch government.
This data allows us to answer two questions. First, what is the general frequency of mental health problems, social behaviors, and pandemic-related concerns in the 2 weeks following a university shut down — and do these variables change over time? And second, do these variables influence each other over time? E.g., do concerns about COVID-19 lead to higher levels of mental health problems at the next measurement point in our time-series data?
3. Let’s talk results!
The following sections covers our 3 main results. This summary is selective and does not cover everything we did — check out the preprint for all analyses and outcomes.
3.1 Comparing pre and post surveys
The first analyses we conducted is to test whether changes of a global mental health scale we queried participants about at both baseline and exit time points changed. The scale measures problems related to depression, anxiety, and stress. Contrary to our expectations, we found no changes.
We repeated the analysis for a loneliness scale we had given participants twice, and found, even more unexpectedly, significant decreases in loneliness. They weren’t very strong, but above chance level (i.e. “statistically significant”, if you want). I discuss the findings, and what they may mean, at the end of the blog post.
3.2 Changes in EMA time-series over time
In the next step, we investigated whether EMA variables that we had assessed 56 times per student during the 2 weeks changes over time. For each of the variables, we asked: “In the last 3 hours, …”

I plot 14 variables below, split into 2 plots to make things a little easier to read. Note that I adapted the y-axis range in the upper of the 2 following figures to increase interpretability; the actual range is 1-5, but nothing happened in the upper 2 point range.

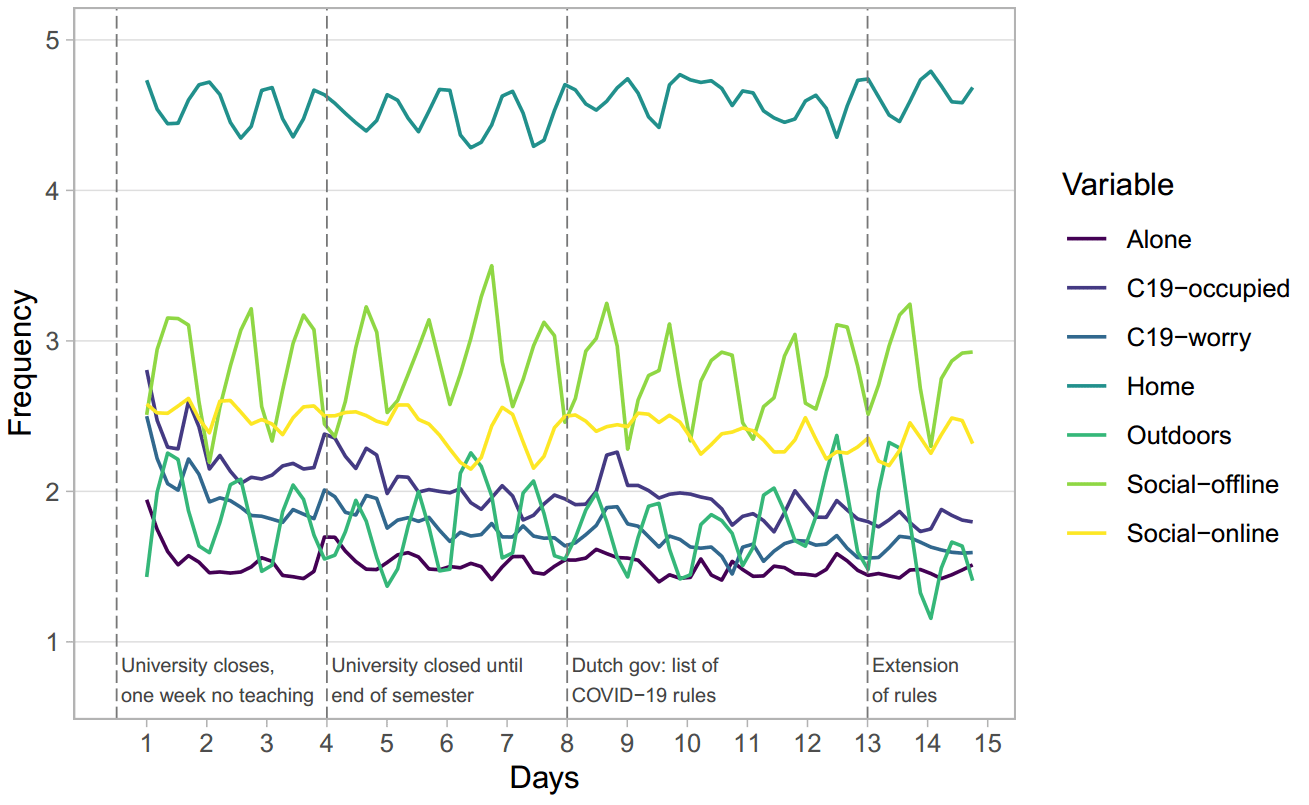
A few things stand out.
First, you don’t see any rapid increases in problems at all, which was unexpected (at least to us). You see a bit of spike in Tired in the upper Figure during the end, but that was a Saturday, and the Saturday before an intense exam week, so it’s not necessarily surprising.
Second, you see that many variables exhibited cyclic patterns, which makes sense, given their nature. E.g. students had more offline social contacts during the afternoon and evening, which explains the “wavy” pattern of this variable.
Third, when analyzing the data statistically, we identified decreases for 10 of the 14 variables: Relax, Irritable, Worry, Nervous, Future, Tired, Alone, Social_online, C19-occupied, and C19-worry. So not only do mental health problems generally go down, but also worries and concerns related to the pandemic and its consequences. We also find that loneliness goes down, corroborating our other results discussed above, that loneliness decreases from baseline to exit. The only item that increased significantly was Home, indicating that students did stay at home more. We found no changes for the remaining variables Anhedonia, Outdoors, and Social_offline. The last finding indicates that the frequency of social contact did not decrease over the 2 weeks time, which, again, is counter to our expectations.
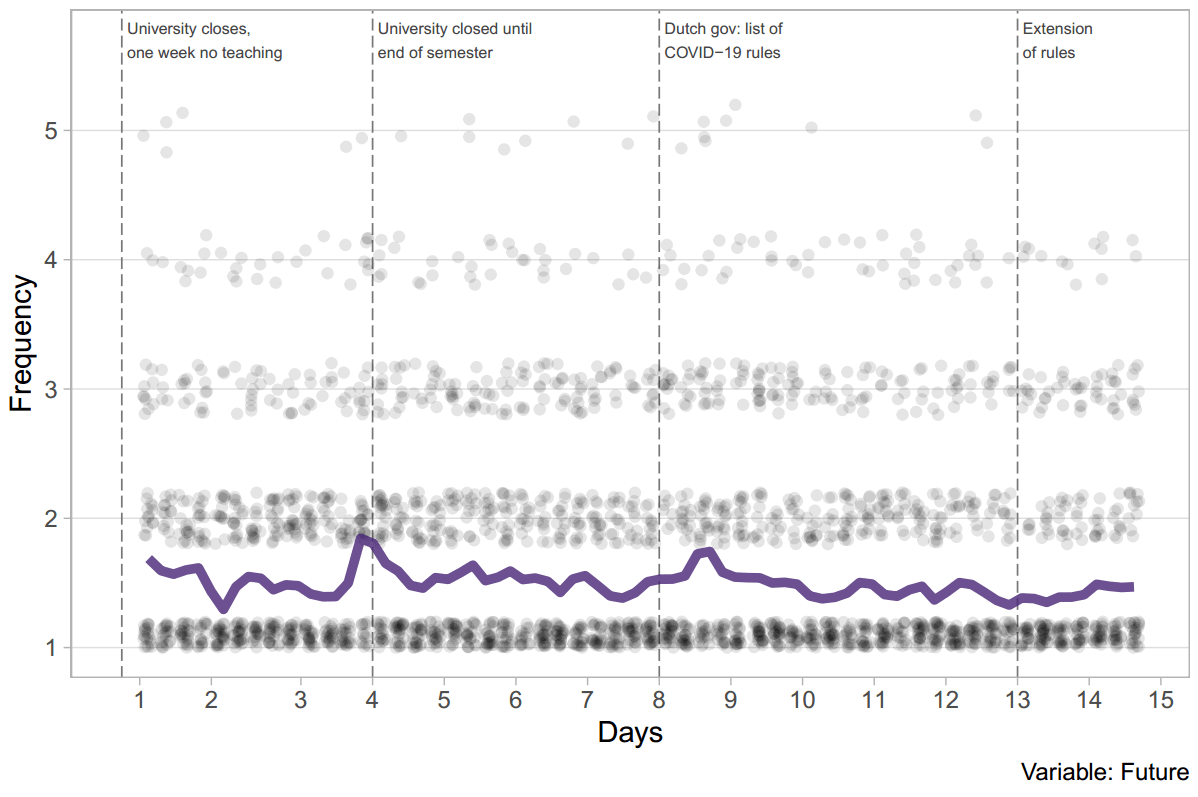
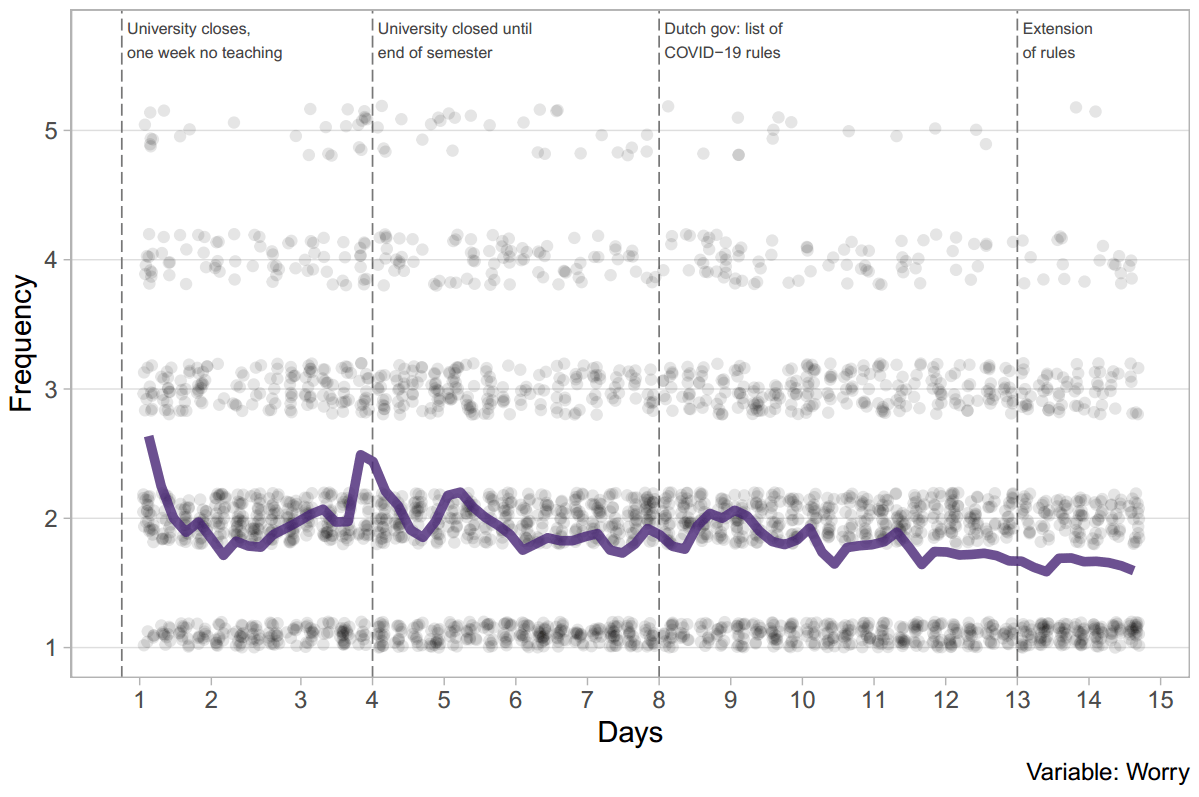
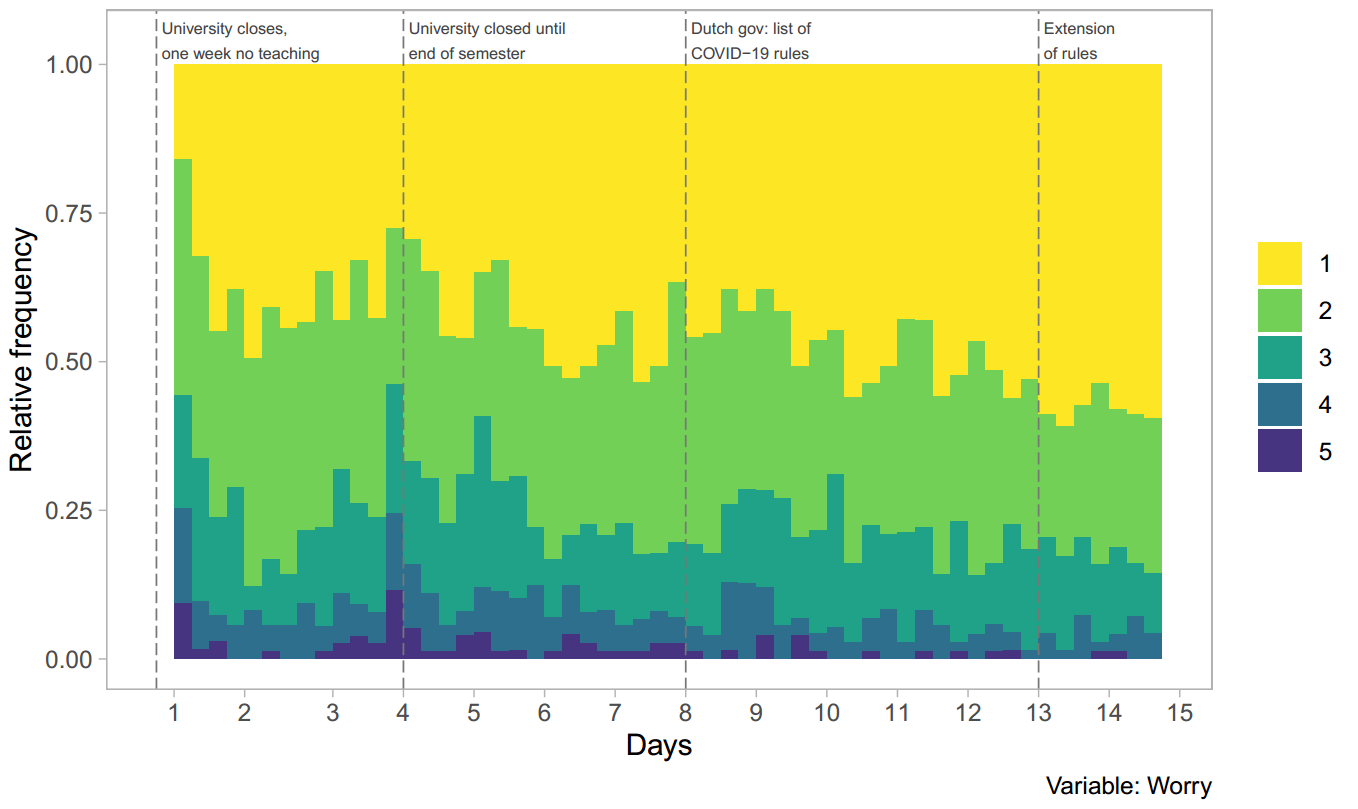
At this point, it’s worth looking into individual EMA items are little bit more in detail, given that the above figures are pretty crowded. So here is the item C19-occupied, which showed the strongest decrease of all of our EMA items (standardized linear slope of -0.14). Both figures below show this item, in two different ways. The first figure shows you the mean across all participants as a line, and each students’ individual data point as a dot. The second shows you the relative frequencies of all answer options. As a reminder, this is the item “in the last 3 hours, I spent __ occupied with the coronavirus (e.g. watching news, thinking about it, talking to friends about it)”, with the answer options 1 (0m.), 2 (1-15m.), 3 (15-60m.), 4 (1-2hrs.), and 5 (>2hrs.).

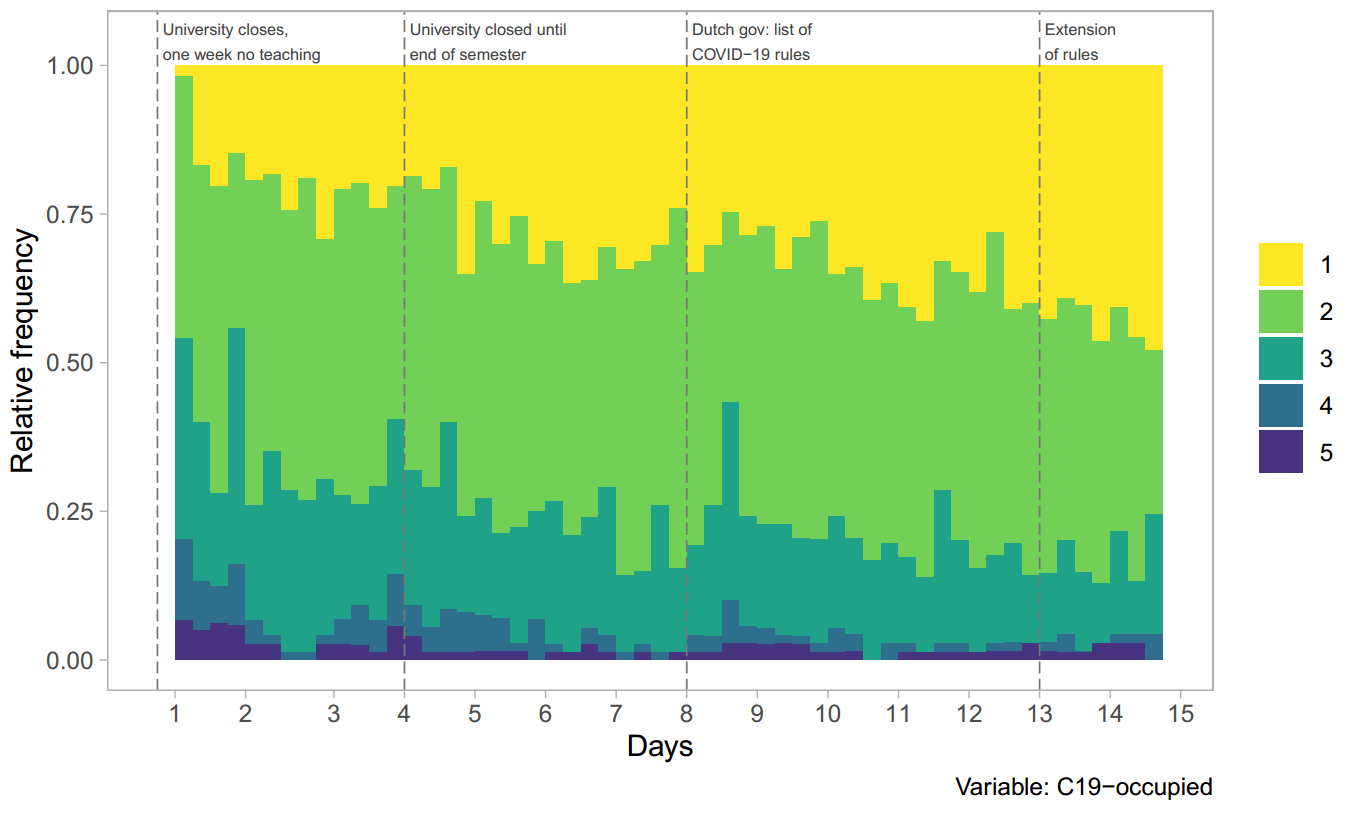
Small peaks can be observed on days 4 and 9. We speculate that this is related to university and government announcements on March 19 (day 4) and March 23 (day 8), because similar peaks can be observed for other EMA items on the same days, such as Future and Worry:
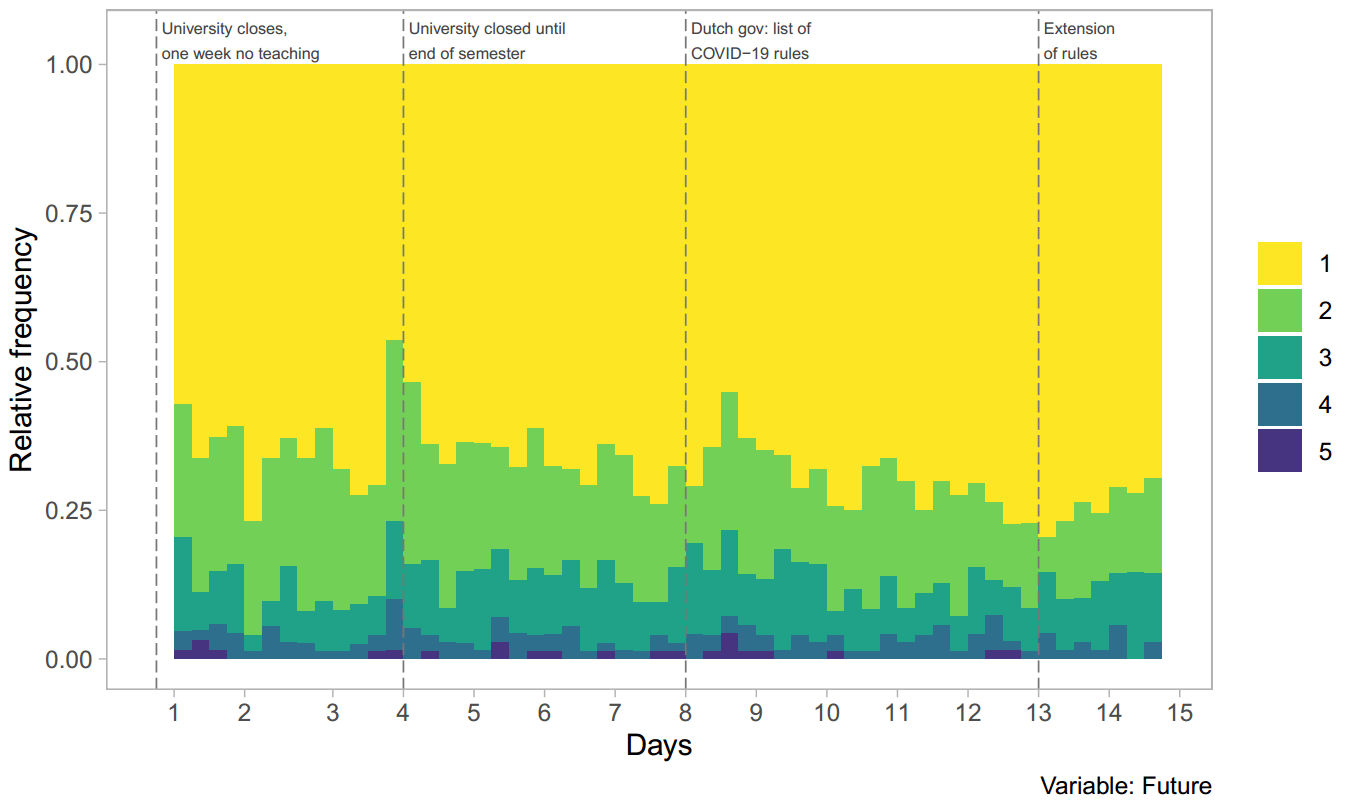
You can find individual plots for all items in our online repository.
3.3 Network models
We also estimated network models for the time series data, a statistical technique that aims to find out whether variables are related with each other, and potentially cause each other. The method cannot inform us about causes, but it can help us generate hypotheses for follow-up work. (EDIT, January 11 2021: note that during the revision of the paper, we have opted to use orthogonal rather than correlated estimation, changing the results slightly; you can find the new results in the updated preprint, and the results displayed here in the supplementary. Overall, they are highly similar, correlation of adjacency matrices = 0.97).
In the second figure above, we identified sine patterns for Home and Social-Offline. If you look more closely, you can see that the pattern is inverted, indicating a negative relationship. Network models try to look into statistical relations of these dynamic patterns of variables, and this is how the results look like. Nodes (circles) are our EMA variables, and edges (connections) are statistical relationships.
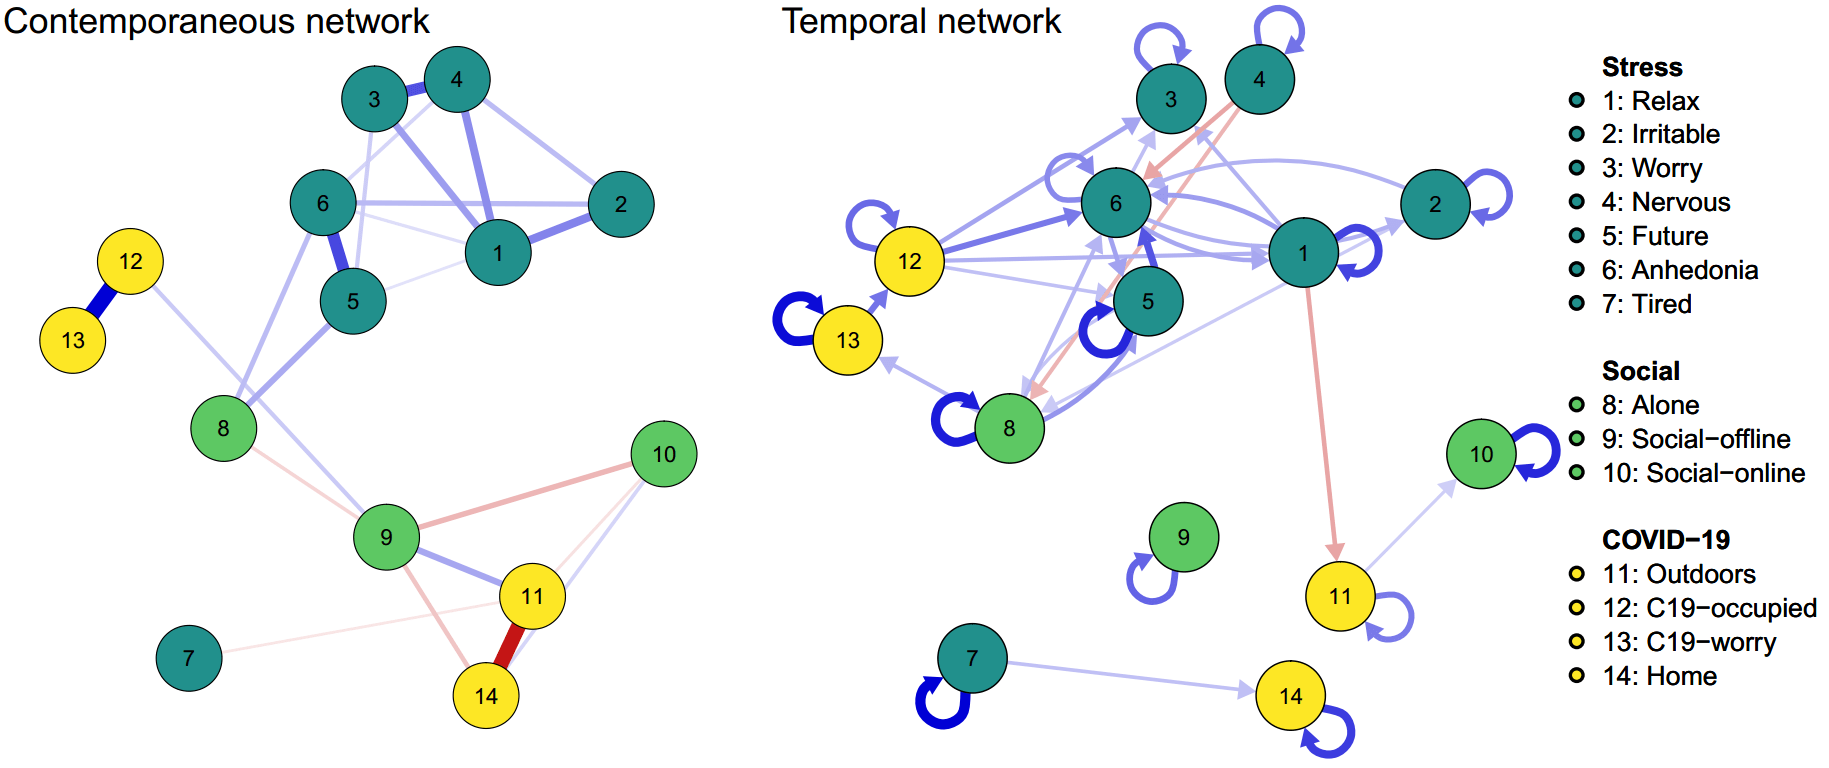
The left network model tests these associations at the same time frame. In this so-called contemporaneous network (i.e. relations among items within the last 3-hour duration of a given beep), we identified many expected relations among items, such as a negative relation between Social_offline and Social_online; a negative relation between Alone and Social_offline; and a strong negative relation between Outdoors and Home (d’oh). Further, we found that mental health items generally clustered together; C19-occupied and C19-worry were related; Alone was related to (concerns about) Future as well as Anhedonia; and Outdoors was positively (and Home negatively) related to Social-offline. All of these make sense to me.
The second network, the so-called temporal network, predicts variables from one measurement occasion to the next — which is why it feature arrows that denote temporal prediction. In this network (i.e. lag-1 relations from one 3-hour measurement period to the next), we identified positive autoregressive coefficients for all nodes (i.e. variables predict themselves, which is very common in these models); largely positive relations among mental health variables; and some vicious cycles, e.g. between (worry about) Future and Anhedonia, (unable to) Relax and Anhedonia, and Future and Alone (vicious circles are when one variable predicts the other and vice versa, visualized as double arrow). Nervous was followed by participants being less Alone at the next measurement point. Interestingly, Alone predicted C19-worry, which was followed by C19-occupied, which in turn predicted a range of mental health variables.
3.4 Exit survey
During the exit survey, about 1 in 5 students told us that they had had symptoms during the last 3 weeks that could indicate a COVID-19 infection, such as fever, cough, or shortness of breath; none had received a formal diagnosis, however. Only 4 students indicated that a close friend or relative had received a COVID-19 diagnosis.
Participants further indicated, on a 5-point Likert scale ranging from 1 (totally disagree) to 5 (totally agree), with 3 being neutral, that2: they started washing their hands more frequently during the study period (M=3.49 [3.32-3.67]); they avoided social activities with many people (M=3.70 [3.56-3.84]); the pandemic impacted their mental health somewhat negatively (M=3.34 [3.06-3.62]); they felt somewhat well informed by Leiden University (M=3.39 [3.11-3.67]) and the Dutch government (M=3.39 [3.11-3.67]); and that the actions taken by Leiden University and the government had had no impact on their stress levels (M=2.88 [2.60-3.16]).
4. Summary of findings: what does it mean?
There is a considerable body of research on student mental health. Prospective stress research is less common, and there is little work monitoring students closely during periods of intense stress. Our preprint reports results of a unique prospective stress dataset collected during the outbreak of the COVID-19 pandemic, a period of dramatic disruptions of students’ daily life. In March 2020, we queried 80 students in the Netherlands on mental health variables 56 times over 2 weeks using a smartphone application, in addition to baseline and exit surveys.
Results indicate no changes on global mental health outcomes from baseline and exit, and reductions on many daily mental health problems, including mood, loneliness, and worries about COVID-19, especially in the first days. Although shocking events such as the pandemic may have rapid adverse short-term effects, our results suggest that many students may be surprisingly resilient, at least in the timespan we observed.
So how do we interpret our results?
One explanation is that there are genuine decreases in some of the variables we measure. Social distancing and isolation may be main drivers of adverse mental health effects, and we observe decreases in loneliness, on two different measures, and no changes in the frequency of social contacts. Since students were doing ok in terms of social contact, that may explain why they are not showing increases in mental health problems (and, in fact, some decreases). Reading up on prior literature, e.g. on the SARS epidemic in 2003, I found some work showing that sense of community goes up in times of crisis, which is how we explain this finding as well. I can’t speak for anyone else, but at least I personally am in touch more with e.g. my parents on the phone than I was a month ago.
Another explanation is that decreases we observed are not genuine decreases, but a quick return to baseline. That would imply that we missed the initial peak of adverse mental health effects, maybe a few days before our study started, and that we observe a quick remission down to the normal level. This would be consistent with some prior work we discuss in more detail in the preprint.
There are other interpretations. For instance, that there are a few people who get dramatically better (but most people get a little worse), making it look like on average, across the whole sample, mental health problems decrease. We looked into this a little and did not find evidence for it. A last interpretation is that the lack of changes, at least from pre to post, is because we analyze a pretty large number of problems together (specifically, we used the a 21-item scale covering depression, anxiety, and stress). We did some post-hoc analyses in that regard, and actually find that there is some evidence for an increase specifically in depressive problems, and a decrease specifically for anxiety problems, and no change for stress-related issues. It will need more future work out to make sense of that.
Overall, our results do very much not mean that the COVID-19 pandemic has no adverse impacts on mental health, and the conclusion that everything is fine would be very much wrong. But it does mean, that at least for many of the particular students we investigated, during the limited amount of time during we which collected data, students were surprisingly resilient.
“Pandemic has benign effects on students” is not the right headline for this.
“These 80 kids are alright, mostly”, probably is.
And because I believe that if we take open science seriously, reporting data back to participants is just as important as sharing data online with other researchers, we (spearheaded by the bachelor students who helped me collect the data) developed a routine to send each participant information about their own personalized data, in a pdf document with about 40 pages each. These pdfs that we are currently in the process of finishing up include the time series of each EMA item, compared to the group average (e.g. how did your personal concerns about COVID-19 develop over the 2 weeks, and how frequent or severe was this compared to the rest of all participants), as well as personalized network models (i.e. your particular relationship among short term dynamics of all EMA variables). We clarify in these reports that the information should be used with care and not over-interpreted, given that some of the statistical procedures we used are novel and still require extensive validation.
Last but not least, the study comes with a host of limitations (e.g. regarding measurement and external validity) discussed in detail on the last page of the preprint.
Acknowledgements
Huge thanks to my co-authors Faidra Papanikolaou and Sacha Epskamp; all bachelor students involved in collecting data for this project [to be named in person soon, but these are 16 students and I want to make sure all of them agree to their names being posted here first]; all bachelor students for participating in this project and agreeing that we can share their anonymized data; and #rstats Twitter for quick help with ggplot2 ;).
- Actually 18 items, but we focus on 14 here, because the others such as ‘listening to music’ or ‘procrastination’ were not directly related to mental health, and analyzing 14 variable simultaneously is already a stretch in terms of statistical power for some of the models we used.
- M indicates mean values, and the […] indicates the confidence intervals, i.e. a plausible range of values
You were very fortunate in the timing of your research. True – it must have been a bit of a disruption at first, but you were able to capture the impact of a once-in-a-lifetime event. Great stuff :)
Thats a fascinating study – i hope it will be properly published as soon as possible, but very useful to see the preprint. Keep up the good work
Thanks—study is accepted in CPS, should be published any week now.
Pingback: ERC Starting Grant on predicting depression onset - Eiko Fried
Pingback: Ecological momentary assessment: app vs web tools? - Eiko Fried
R/mgcv can get you a working solution easy with something like :
library(mgcv)
library(itsadug)
echo=bam(Q1 ~ s(Day) + s(ID, bs=”re”), family=ocat(R=5), data=clean_ema)
plot_smooth(echo, view=”Day”, rm.ranef=T)
# or slightly more complex, assuming a Day*beepvar interaction :
echo2=bam(Q1 ~ s(Day) + s(beepvar, k=4) + ti(Day, beepvar, k=4) + s(ID, bs=”re”), family=ocat(R=5), data=clean_ema)
fvisgam(echo2, view=c(“Day”, “beepvar”), rm.ranef=T)
Bye friend !
-Corentin
Thank you so much !! Will consider it for the revision (in case we get there with the paper).
Great work !
Have you considered GAMM analyses to model trends over time in section 3.2 ? They work rather well on your OSF data and show significant linear and non-linear trends for the various items. The “G” part can handle ordered categorical data like your Likert items, the “A” part is useful to model nonlinear trends, and the second “M” handles the mixed-design structure with random intercepts or even random nonlinear trajectories per subject. Not too hard to run once you get the gist of it.
Best,
-Corentin
Hey friend! Thanks for the suggestion, we hadn’t considered that, and they may be more appropriate than the regressions we’re running right now!